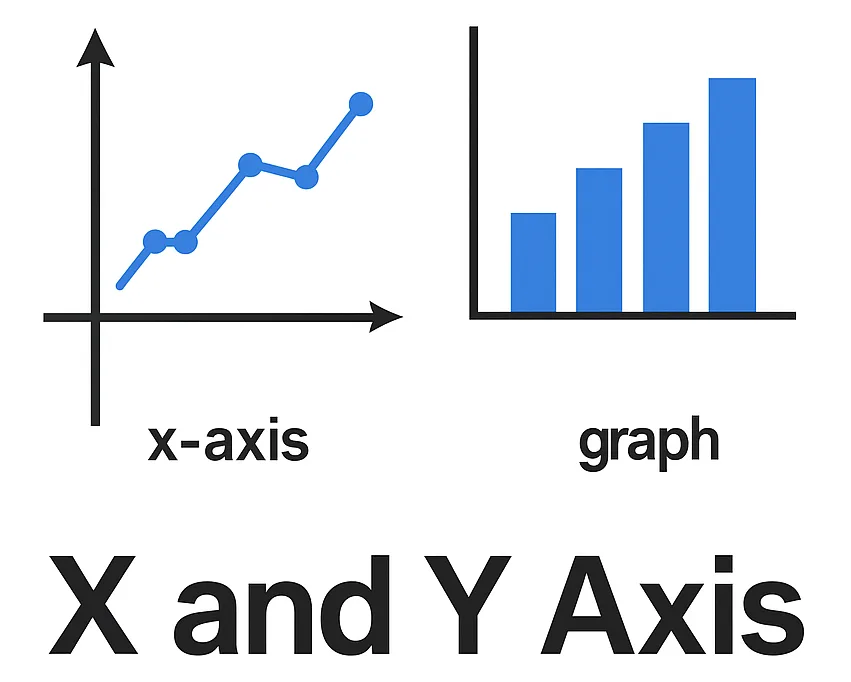
Understanding graphs is an essential part of math, statistics, engineering, and many other disciplines. At the heart of every graph lies the X and Y axis, which define the layout and structure upon which data is plotted. In this article, we will explore what the X and Y axis are, their significance in graphs, and give examples to help you understand their role clearly.
What is the X Axis?
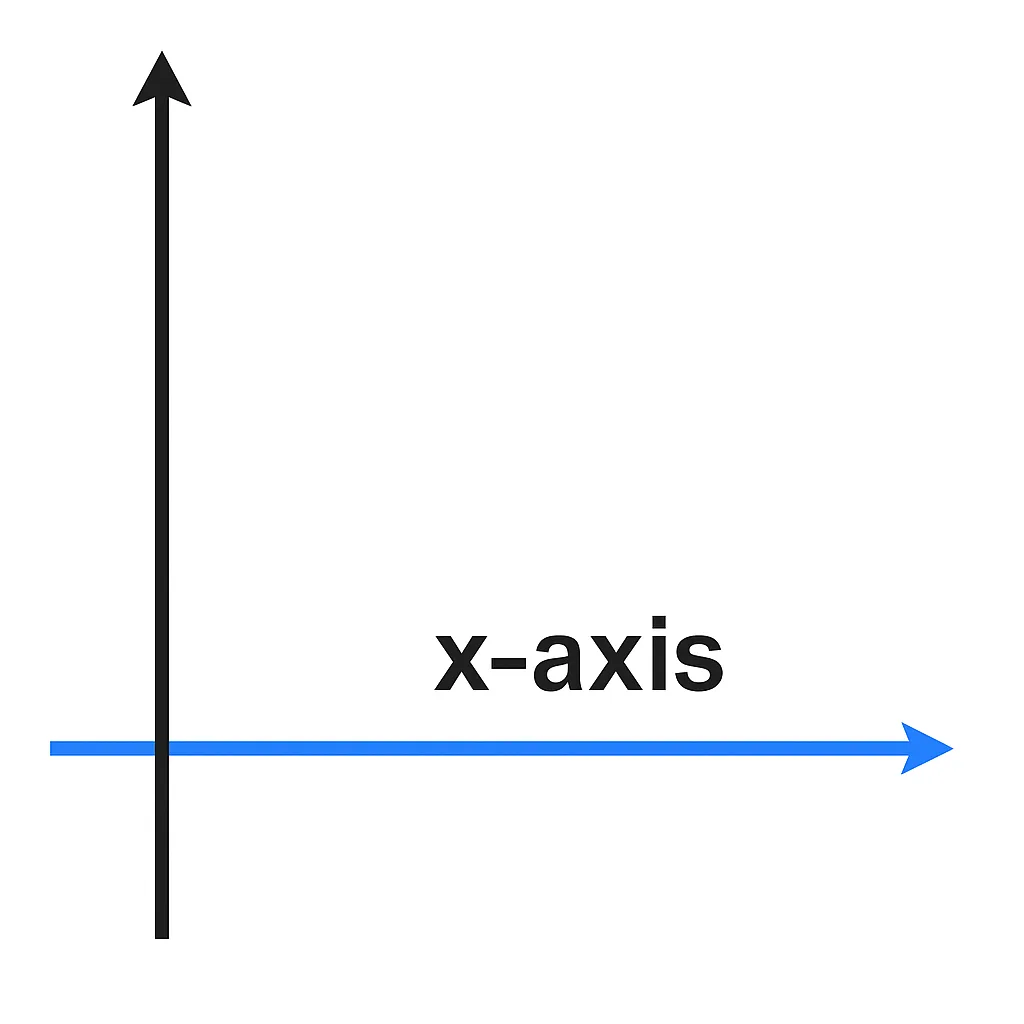
The X axis is the horizontal line on a graph. It is used to represent the independent variable, or the input of the data. The X axis typically runs from left to right across the page. In many cases, the X axis can represent units of time, quantity, or any other measure that changes consistently across the range of data.
Example of X Axis Usage:
If you are plotting a graph of a person’s weight over a period of ten years, the X axis would represent the ten years, with markers like “Year 1,” “Year 2,” and so forth.
What is the Y Axis?
The Y axis is the vertical line on a graph. It is used to display the dependent variable, or the output associated with the input value from the X axis. The Y axis typically shows quantity or magnitude and can be used for measures such as weight, cost, or temperature.
Example of Y Axis Usage:
Continuing with the earlier example, the Y axis would display the person’s weight in kilograms, ranging from 50 kg to 100 kg, making it easy to understand changes over the ten-year period.
Why Are X and Y Axis Important?
The X and Y axis form the foundation of Cartesian coordinate plotting. They enable us to visually understand the relationship between variables. Without the X and Y axis, data would lack context and the ability to be compared effectively. Together, the X and Y axis help make complex data comprehensible by representing it visually.
What are X and Y Axis on a Graph?
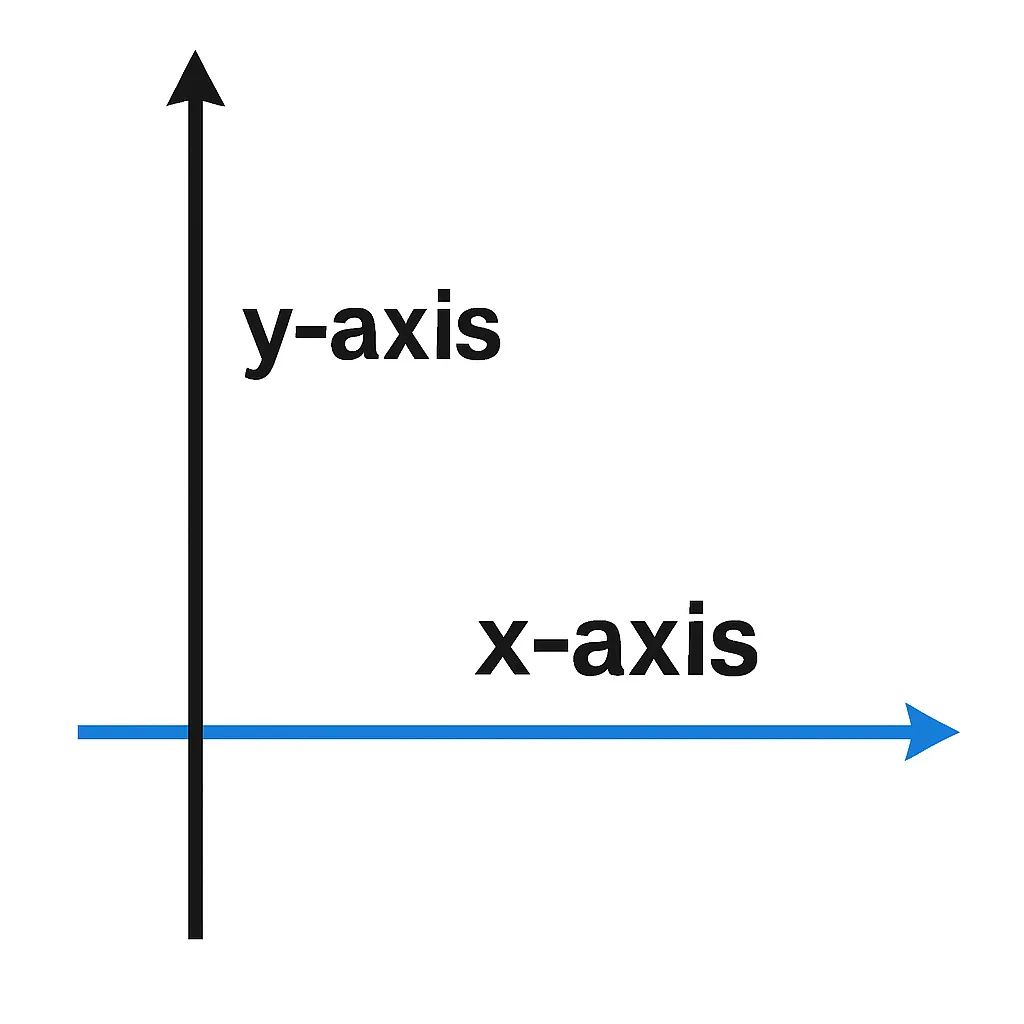
When you look at a graph, you’ll see two main lines:
- X Axis: The line that runs left to right (horizontal). It usually shows the independent variable — something that you control or measure over time, like days, months, or categories.
- Y Axis: The line that runs up and down (vertical). It shows the dependent variable — the results or data that change based on the X axis, like height, weight, sales, or temperature.
Example
If you’re tracking how much water you drink each day:
- X axis = days (Day 1, Day 2, Day 3)
- Y axis = liters of water (1L, 2L, 3L)
Each point on the graph shows how much water you drank on a specific day.
How to Read a Graph with X and Y Axis
To read a graph, locate a point, and observe where it falls in relation to both the X and Y axis. The X coordinate tells you the input value (e.g., year), while the Y coordinate provides the output value (e.g., weight). By following these coordinates, you can pinpoint data precisely.
Common Graph Types Using X and Y Axis:
Line Graphs: Frequently used for showing data trends over time. The X axis represents time, while the Y axis shows the measured quantity.
Bar Graphs: The X axis displays categories, while the Y axis displays quantity or frequency.
Scatter Plots: Both the X and Y axis depict numerical data, making it ideal for finding relationships and patterns.
Additional Examples:
- A business plotting sales over a year will have “Month” on the X axis and “Sales Amount” on the Y axis.
- A scientist measuring temperatures across days will place “Days” on the X axis and “Temperature (°C)” on the Y axis.
Conclusion
The X and Y axis are fundamental elements in graphs that enable accurate data plotting and interpretation. Understanding their roles allows one to make sense of complex information quickly, aiding in making better decisions. Whether you’re a student tackling math problems, a scientist conducting experiments, or a manager assessing sales trends, mastering the X and Y axis is vital for interpreting data effectively.
By learning how the X and Y axis operate, you can gain valuable insights from graphs and present data clearly and effectively. This basic yet essential knowledge forms the backbone of data literacy across disciplines, making it an indispensable skill in today’s information-driven world.
Additional Insights
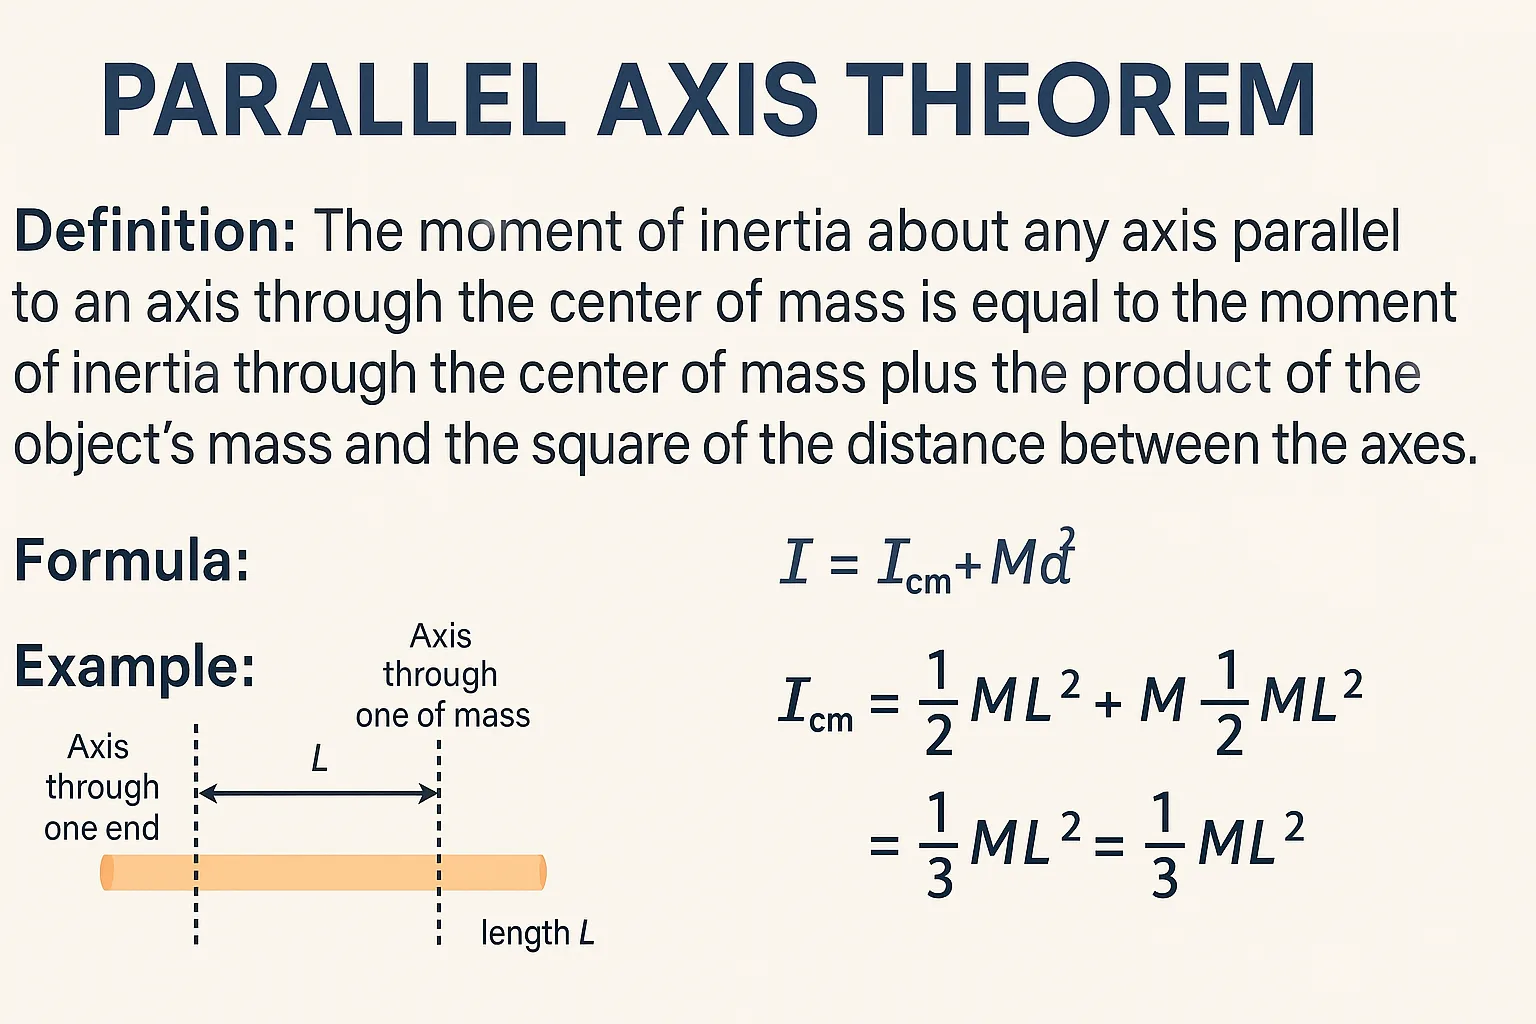
Parallel Axis Theorem – Definition, Formula, Derivation & Applications

Axis of Symmetry: Definition, Equation, and Real-Life Applications
Coconut Spanish Translation

Cashew Spanish Translation
Axis Definition and Meaning

Walnut in Spanish Translation

Almond in Spanish – Translation and Meaning

Hazelnut in Spanish – Understanding the Word “Avellana”